Usage
Basic features
Similar to many genome browsers, Geneviz displays individual types of genomic features or data as separate tracks. Within Geneviz, each track derives from the class Track, which defines a common interface for each track. Many basic tracks take their data from a pandas DataFrame, although some more specialized tracks may query their data directly from different sources.
Tracks are drawn using the function plot_tracks, which takes a list of tracks and the genomic region that should be drawn. The function ensures that only the required region is plotted and that data from the different tracks are aligned properly. Regions are defined by a chromosome name and a start/end position, thereby restricting a plot to a genomic locus on a single chromosome. Geneviz does not yet support plotting multiple chromosomes in a single plot.
An example plot is shown below, in which we draw three genomic features (representing insertions) along side the mouse gene annotation. We first create a FeatureTrack, which provides functionality for drawing simple stranded/unstranded genomic features and is responsible for drawing our insertion features. We provide this track with a Dataframe containing the locations of the three features. Second, we build a gene track which is responsible for drawing the gene features. In this case we use a biomart track, which queries gene definitions from Ensembl using biomart.
# Build the feature track.
features = pd.DataFrame.from_records(
    [('1', 182448297, 1),
    ('1', 182448100, 1),
    ('1', 182419592, -1)],
    columns=['chromosome', 'position', 'strand'])

feature_track = FeatureTrack.from_position(
    features, width=3500, height=0.5, hue='strand')

# Build the gene track.
gene_track = BiomartTrack(
    collapse='transcript',
    dataset='mmusculus_gene_ensembl',
    gene_id='gene_name',
    height=0.5)

# Plot the tracks together.
plot_tracks(
    [feature_track, gene_track],
    region=('1', 182399172, 182462432),
    figsize=(10, None),
    despine=True)
Altogether, this gives us the following result:
(Source code, png, hires.png, pdf)

Hopefully this gives a general idea of how to create genomic plots using Geneviz. See below for an overview of the different types of tracks that are currently aviable.
Available tracks
Feature track
The feature track is a multi-purpose track that provides functionality for drawing (stranded) features along the genome. Features can consist of one or multiple genomic ranges, which can optionally be grouped into composite elements if needed. As such, this track can represent anything from simple features such as read alignments, CpG islands or even genes and gene transcripts.
A feature track is using from a dataframe that describes the different features. In this dataframe, each row represents a single feature. The dataframe must contain the four columns ‘chromosome’, ‘start’, ‘end’ and ‘strand’; which together describe the position and orientation of these features. The strand column may contain null values (np.nan or None), indicating that the corresponding feature is unstranded.
Additional columns may be provided to control different aesthetics of the drawn features. For example, when combined with the ‘hue’ argument, categorical columns can be used to determine the color of individual features. Similarly, the ‘label’ argument can be used to indicate which column should be used to add labels to the features.
Individual features
A simple example for drawing single features is shown below:
# Example features.
features = pd.DataFrame.from_records([
        ('1', 10, 25, 1, 'a', 'a'),
        ('1', 30, 40, None, 'a', 'b'),
        ('1', 50, 70, None, 'a', 'c')
    ],
    columns=['chromosome', 'start', 'end',
             'strand', 'group', 'type'])

# Plot track.
feat_track = FeatureTrack(data=features)
plot_tracks([feat_track], region=('1', 0, 80),
            figsize=(5, None), despine=True)
(Source code, png, hires.png, pdf)

In this example, we first construct a dataframe features, which contains three rows representing three features (one stranded and two unstranded). This dataframe is used to construct a FeatureTrack instance, which we then plot using the plot_tracks function. Notice that stranded features are drawn using directed arrows to indicate their direction, whilst unstranded features are drawn as rectangles.
As mentioned above, we can also style and annotate features using values in the dataframe. For example, using the hue argument, we can color features depending on their type, whilst using the label argument, we can also add label annotations:
FeatureTrack(data=features, hue='type', label='type')
(Source code, png, hires.png, pdf)

An important feature of the FeatureTrack is that overlapping features are stacked automatically, to avoid overplotting features. The height and vertical spacing between features than be controlled using the height and spacing arguments.
TODO: example.
Composite features
Complex genomic features typically consist of several features spanning different genomic ranges. For example, genes typically consist of several exons, which are together form gene transcript(s). To represent such composite features, the feature track supports grouping of individual features. Groups can be specified using the group argument, which should refer to a categorical column in the dataframe. Groups of features are drawn together and are connected by junctions between the individual junctions.
FeatureTrack(data=features, hue='type', group='group', label='group')
(Source code, png, hires.png, pdf)

The argument strand_junctions determines whether the features themselves are drawn with their respective strands (strand_junctions = False) or if the junctions are used to indicate the strand of the overall group (strand_junctions = True). In the latter case, junctions that angle upwards indicate groups on the forward strand (from left to right), whilst junctions that angle downwards indicate groups on the reverse strand:
FeatureTrack(data=features, hue='type', group='group',
             label='group', strand_junctions=True)
(Source code, png, hires.png, pdf)

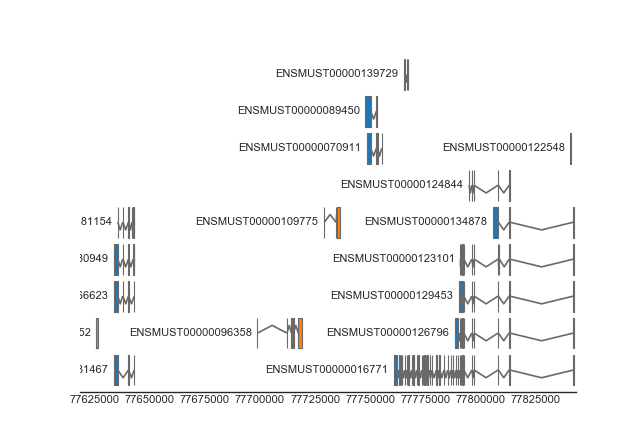
Gene tracks
Specialized tracks are provided for drawing gene/transcripts. Internally, these tracks use the FeatureTrack for the actual drawing, but provide additional functionality for querying gene/transcript definitions and for collapsing gene transcripts.
from geneviz.tracks import BiomartTrack, plot_tracks

gene_track = BiomartTrack(
    dataset='mmusculus_gene_ensembl',
    hue='strand',
    gene_id='gene_name',
    transcript_id='transcript_id',
    height=0.5,
    spacing=0.1)

plot_tracks(
    [gene_track],
    region=('15', 77618614, 77843156),
    despine=True,
    figsize=(8, None))
(Source code, png, hires.png, pdf)

BiomartTrack(
    dataset='mmusculus_gene_ensembl',
    hue='strand',
    gene_id='gene_name',
    transcript_id='transcript_id',
    height=0.5,
    spacing=0.1,
    collapse='transcript')
(Source code, png, hires.png, pdf)

BiomartTrack(
    dataset='mmusculus_gene_ensembl',
    hue='strand',
    gene_id='gene_name',
    transcript_id='transcript_id',
    height=0.5,
    spacing=0.1,
    collapse='gene')
(Source code, png, hires.png, pdf)

NGS tracks
TODO